Network downtime costs $9,000 per minute — your remote diagnostics stack must parse syslog floods and correlate events faster than human engineers can.
AI-assisted remote diagnostics for network equipment cut mean time to resolution by 40% or more, per Bruviti deployment data. Builders wire fault telemetry, ticket history, and KB content into one auto-triage layer so L1 and L2 engineers resolve incidents at the edge instead of escalating. Diagnosis happens before a truck or a senior engineer is ever dispatched.
Router and switch logs arrive in dozens of vendor-specific formats. Building parsers for Cisco IOS, Juniper JunOS, Arista EOS, and SNMP traps demands months of regex engineering and maintenance.
A single BGP flap generates hundreds of downstream alerts across routers, firewalls, and load balancers. Correlating events to identify root cause requires real-time graph analysis at scale.
Solutions live in Confluence, Jira tickets, chat logs, and engineer notebooks. Your guided troubleshooting API needs semantic search across unstructured sources to surface relevant resolutions.
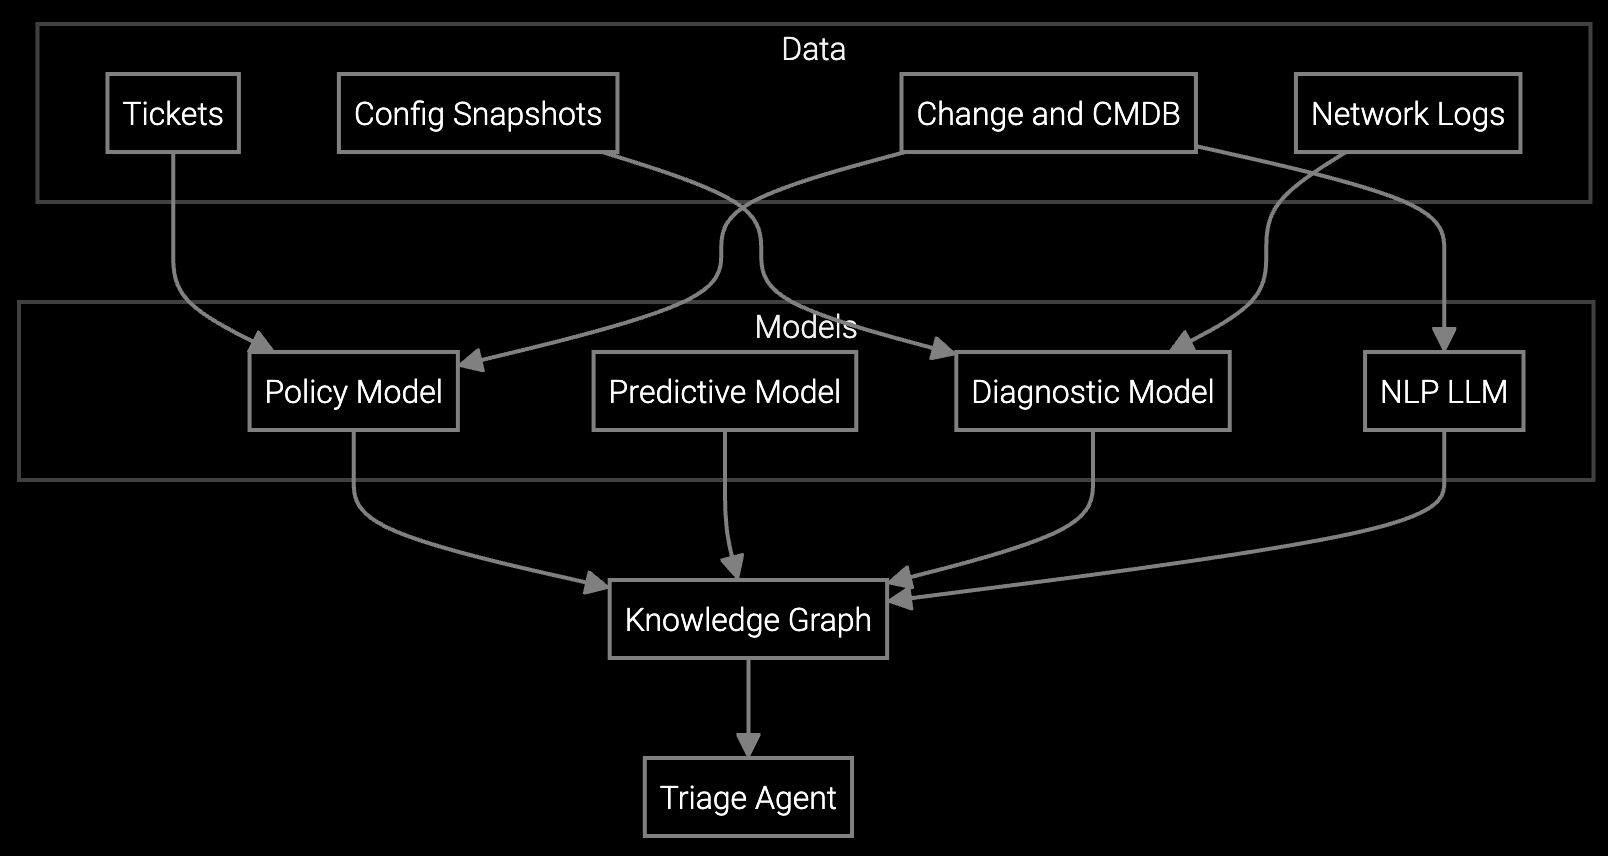
Bruviti provides Python and TypeScript SDKs that ingest syslog, SNMP, and NetFlow streams through standard protocols. The platform pre-trains parsers on 200+ network device types, eliminating manual regex maintenance. Your code calls API endpoints to submit raw logs and receives structured JSON with severity, device context, and probable cause.
Event correlation runs through a temporal graph engine that tracks device relationships, configuration changes, and historical failure patterns. The SDK exposes GraphQL queries for custom root cause analysis workflows. You own the data pipeline — logs stay in your VPC, and models retrain on your labeled incidents without sending proprietary data to external servers.
Network OEMs deploy Bruviti's log ingest agents alongside existing NOC tools. Syslog collectors run as lightweight containers on the same Kubernetes clusters hosting monitoring dashboards. The platform connects to SNMP management stations, NetFlow exporters, and firmware update systems through read-only APIs — no changes to production network configurations.
For carrier-grade equipment, the SDK integrates with vendor-specific telemetry streams from Cisco IOS XR, Juniper MX routers, and Nokia 7750 SR platforms. Engineers write custom Python scripts that query the correlation API during incident response, feeding results directly into ServiceNow or PagerDuty workflows. The headless design avoids replacing existing remote access tools like TeamViewer or LogMeIn.
Bruviti pre-trains NLP models on network equipment documentation and log samples from 200+ device types. The Python SDK automatically detects vendor format based on syslog headers and applies the correct parser. When you encounter a new format, submit sample logs through the API and the platform retrains parsers within 48 hours without requiring your team to write regex rules.
Yes. The platform supports air-gapped deployments using Docker Compose or Kubernetes. Logs and telemetry never leave your VPC. Model training runs locally on your labeled incident data. The cloud-hosted version offers faster updates to pre-trained parsers, but all core functionality works offline for network OEMs with strict data sovereignty requirements.
Python and TypeScript are fully supported with type-safe SDKs. For other languages, use the REST API directly — it exposes OpenAPI specs for generating client libraries. The GraphQL endpoint lets you query event graphs using any HTTP client. Most network OEM engineering teams use Python for automation, so we optimize SDK ergonomics and documentation for that ecosystem.
The platform exposes webhook endpoints that trigger when correlation identifies probable cause. Your TeamViewer or LogMeIn session can call the API to fetch step-by-step remediation scripts based on device type and failure signature. The SDK includes a lightweight JavaScript widget that embeds diagnostic suggestions directly into web-based remote consoles without requiring screen-sharing integrations.
Most network OEMs see measurable results within 60 days. Week 1 involves deploying syslog collectors and connecting to SNMP traps. Weeks 2-4 focus on labeling 50-100 historical incidents to train correlation models. By week 8, the system flags root cause accurately enough that NOC teams trust it for tier-1 triage. Full ROI measurement requires 90 days to compare pre/post remote resolution rates.

Software stocks lost nearly $1 trillion in value despite strong quarters. AI represents a paradigm shift, not an incremental software improvement.
Function-scoped AI improves local efficiency but workflow-native AI changes cost-to-serve. The P&L impact lives in the workflow itself.

Five key shifts from deploying nearly 100 enterprise AI workflow solutions and the GTM changes required to win in 2026.
Talk to our solutions architects about API access, SDK documentation, and proof-of-concept deployments.
Schedule Technical Demo