Hyperscale demands instant resolution—manual log parsing and fragmented tools delay MTTR and waste engineering cycles.
Bruviti deployment data shows remote diagnostics for data center infrastructure cut resolution time from 24 hours to 3 hours. Builders wire equipment telemetry and log streams into a workflow-first agent that triages faults before a human reviews them, so critical infrastructure cases that once took over 24 hours to close now resolve same-shift.
BMC logs, IPMI events, and thermal sensors live in separate silos. Support engineers manually stitch together data from compute, power, and cooling systems before diagnosing the root cause.
When remote sessions fail to resolve issues, handoffs to hardware specialists lack context. Engineers re-collect logs, duplicate triage steps, and delay resolution by hours.
Proprietary remote access platforms trap data in closed ecosystems. Adding new OEM equipment or integrating with existing IT systems requires costly professional services and API workarounds.
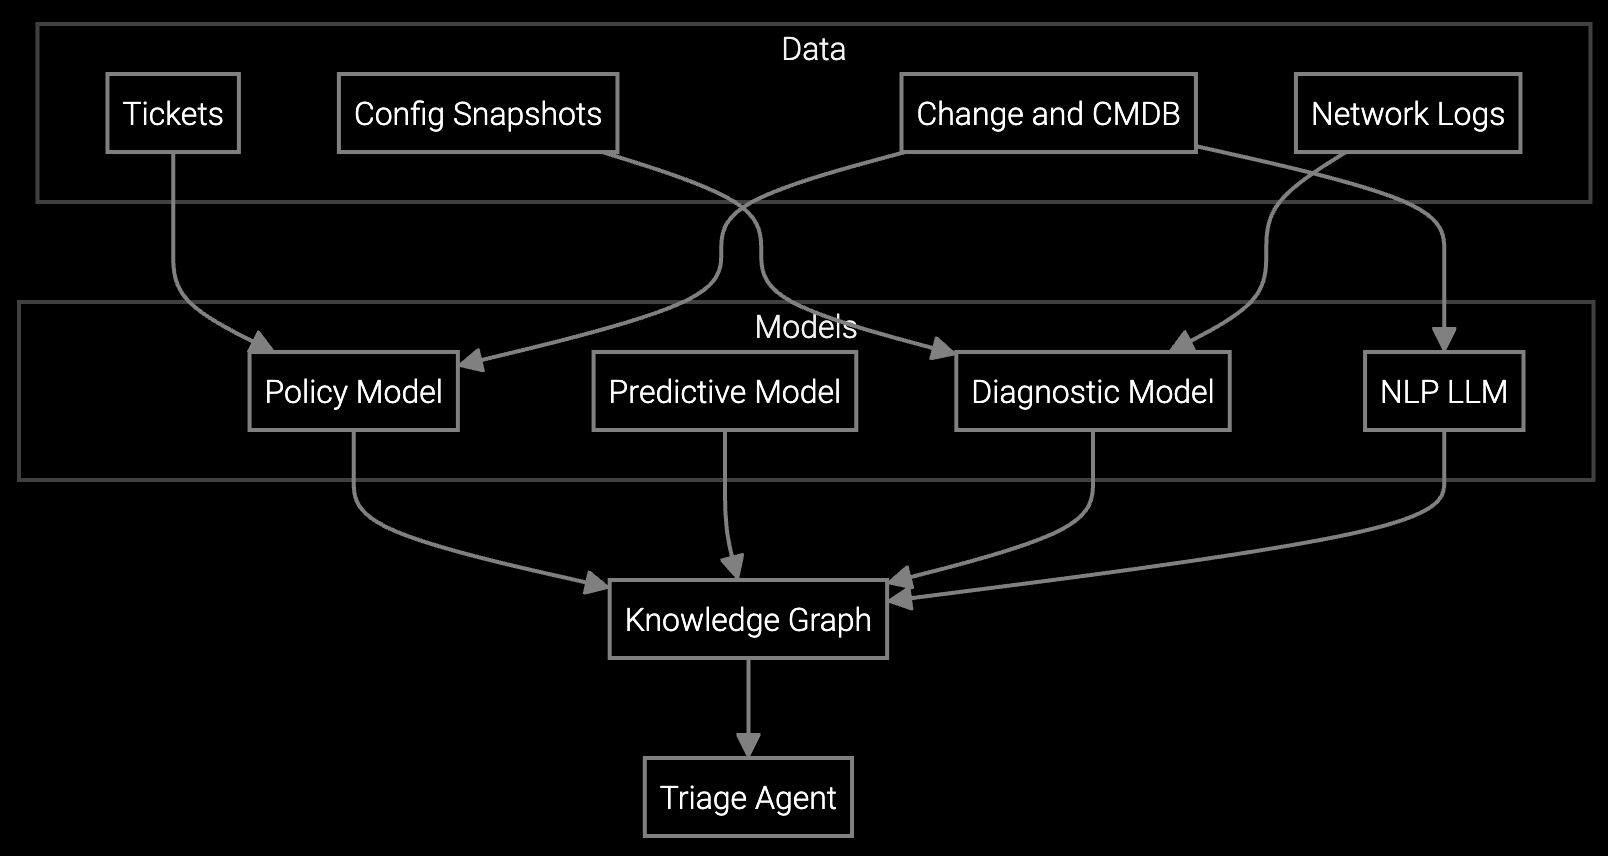
Bruviti's platform provides Python and TypeScript SDKs that ingest telemetry streams from IPMI, BMC, and custom data lakes, then apply ML models trained on historical failure patterns. The system parses unstructured log data, identifies anomalies across thermal, power, and compute subsystems, and outputs structured diagnostic reports with root cause hypotheses.
Deploy as a headless service alongside existing remote access tools. RESTful APIs accept telemetry in real time, return triage recommendations in under 200ms, and integrate with your case management system via webhooks. No black boxes—retrain models on your data, export features for custom workflows, and maintain full control over resolution logic.
Data center OEMs ship equipment into environments managing millions of compute nodes. Remote diagnostics must parse BMC logs, IPMI events, and thermal sensor streams at scale—correlating failures across racks, power distribution units, and cooling systems before customers experience downtime.
The platform ingests telemetry via standard protocols (Redfish, SNMP, syslog) and applies ML models trained on historical hardware failures. Support engineers receive structured root cause analyses instead of raw log dumps, reducing session duration and improving remote resolution rates before escalating to hardware specialists.
The platform ingests IPMI SEL logs, Redfish event streams, SNMP traps, syslog, and custom JSON payloads. Python SDKs include parsers for common BMC formats (Supermicro, Dell iDRAC, HPE iLO). You can extend parsers for proprietary formats using the model retraining API.
Deploy as a headless diagnostic layer. The platform consumes telemetry via APIs and returns triage recommendations, which integrate into your existing case management system via webhooks. Support engineers continue using current remote tools—they simply receive better diagnostic guidance.
Yes. The Python SDK includes a model training module that accepts labeled failure data (telemetry samples + root cause labels). Train on your data lake, export the model, and deploy it via the inference API. You maintain full ownership of training data and model weights.
The inference API returns triage recommendations in under 200ms for standard BMC log payloads (up to 10MB). Batch processing handles larger telemetry archives (full rack dumps) in 2-5 seconds. Deploy on-premises or in your VPC to eliminate WAN latency.
The system correlates failures across compute, power, and thermal subsystems before remote sessions begin. Support engineers receive root cause hypotheses (e.g., "PSU voltage drop detected 40 minutes before server failure") instead of raw logs. This enables resolution during the initial session, avoiding escalations.
Software stocks lost nearly $1 trillion in value despite strong quarters. AI represents a paradigm shift, not an incremental software improvement.
Function-scoped AI improves local efficiency but workflow-native AI changes cost-to-serve. The P&L impact lives in the workflow itself.
Five key shifts from deploying nearly 100 enterprise AI workflow solutions and the GTM changes required to win in 2026.
Access SDKs, sandbox environments, and integration guides to deploy remote diagnostics in your stack.
Get API Access