Legacy equipment with 20+ year lifecycles creates impossible inventory tradeoffs—overstock ties up capital, understock delays repairs.
Balance inventory carrying costs against service availability by applying demand forecasting models to installed base data, capturing failure patterns by equipment age and usage intensity to optimize stock levels across distribution networks.
When critical parts aren't in local inventory, overnight shipping costs erode service margins while customers face extended downtime. For industrial equipment where production stops cost thousands per hour, stockouts trigger penalty clauses and customer defections.
Conservative forecasting leads to warehouses full of obsolete components for discontinued equipment models. Parts for legacy machinery from the 1990s sit unused while tying up millions in carrying costs, insurance, and warehouse space.
Manual demand planning based on historical averages misses emerging failure patterns tied to equipment age, operating conditions, and regional usage intensity. Planners lack visibility into which machines are entering high-failure zones, leading to systematic misallocation across the distribution network.
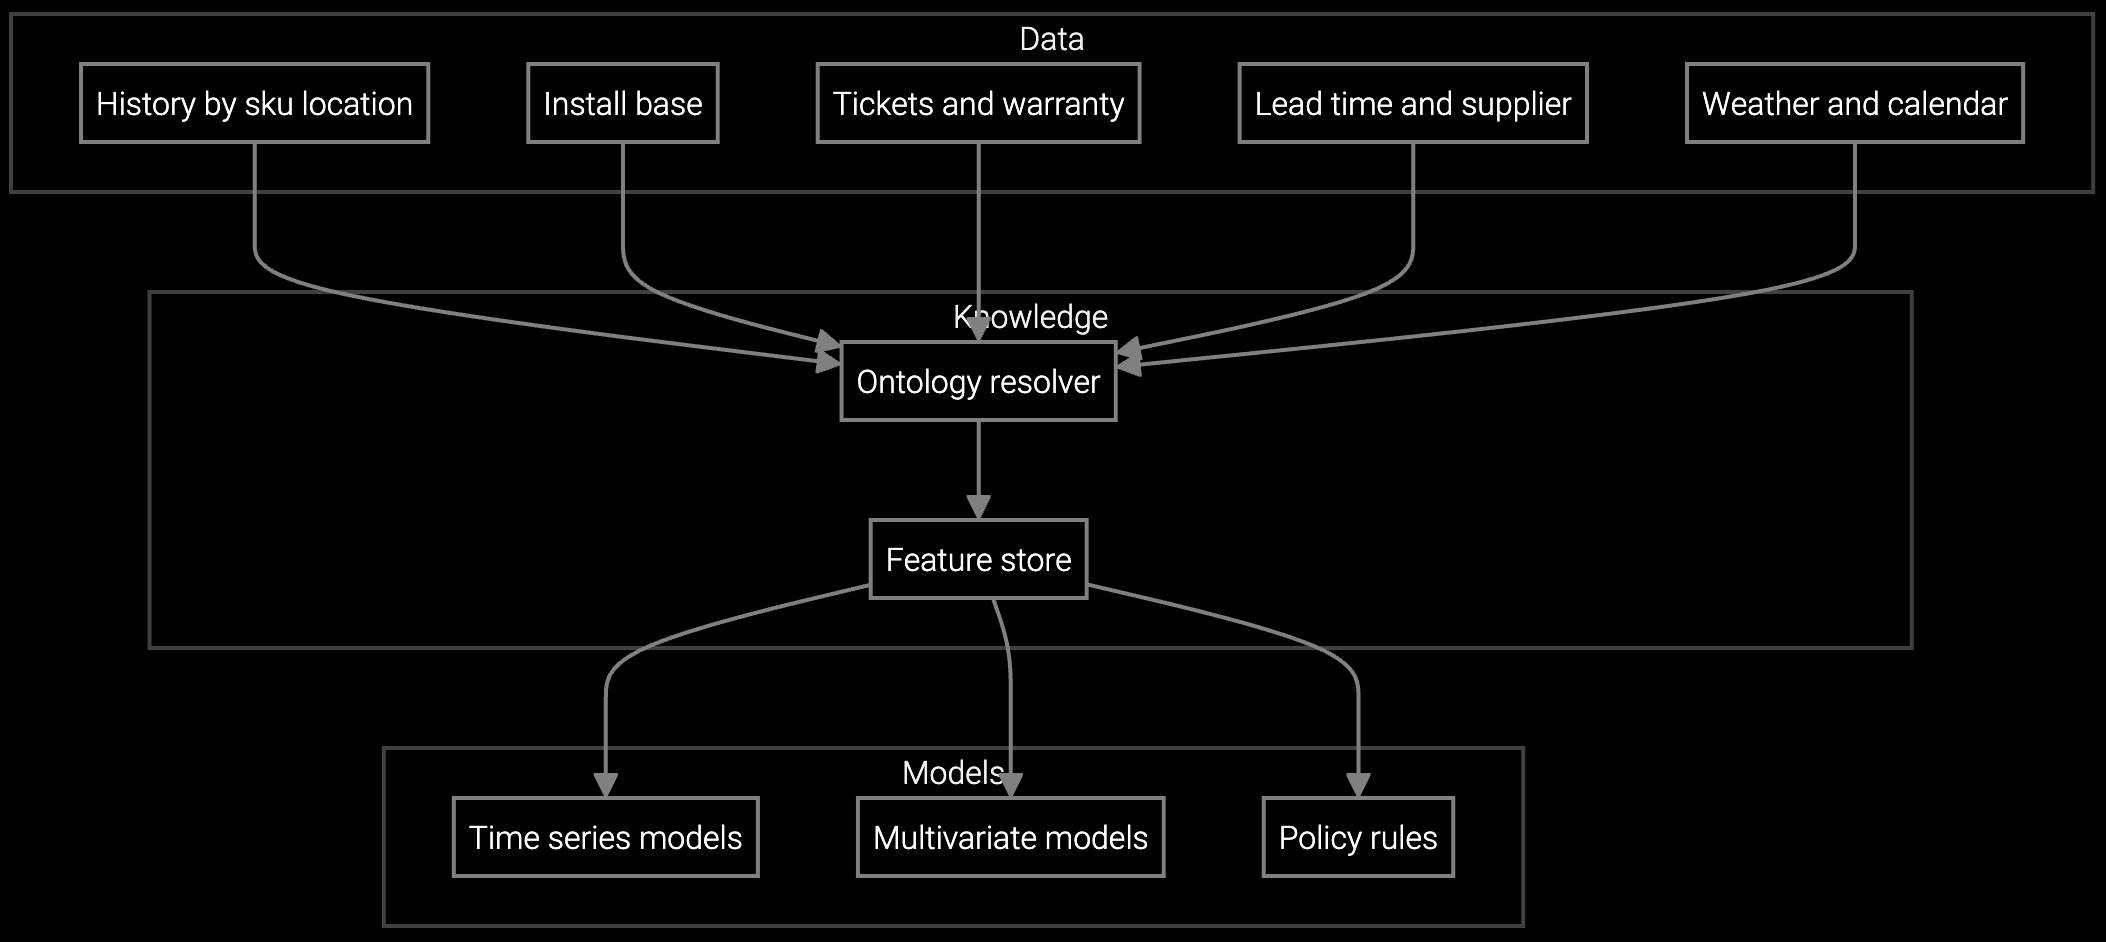
The platform ingests telemetry from SCADA systems, maintenance histories, and warranty claims to model failure probabilities at the individual asset level. By correlating run hours, vibration signatures, and temperature profiles with historical parts consumption, the system forecasts demand by part number, location, and time horizon—identifying which components will fail before they trigger emergency orders.
Instead of planning inventory based on aggregate sales history, the AI continuously recalibrates stock targets based on the actual condition and usage intensity of deployed equipment. When a cohort of CNC machines reaches 15,000 operating hours—a known failure threshold for spindle bearings—the system automatically adjusts regional inventory weeks in advance. This shifts planning from reactive replenishment to predictive positioning, reducing both stockouts and excess holding costs.
Projects consumption patterns for pumps and compressors based on installed base age cohorts, capturing seasonal demand spikes in heavy manufacturing environments.

Optimizes multi-echelon inventory placement by forecasting which distribution centers will need specific bearings and seals based on regional equipment profiles.

Field crews photograph failed turbine components to instantly retrieve part numbers and check availability, accelerating quote-to-repair cycles.
Industrial OEMs support machinery deployed decades ago—CNC mills from 1998, compressors from 2002, power generation turbines from the 1980s. Each vintage has unique parts specifications, and manufacturers face continuous obligations to maintain availability for equipment that predates modern ERP systems. The result is fragmented parts catalogs across product lines and geographies, where planners struggle to connect current inventory positions with actual installed base risk profiles.
The platform unifies telemetry from legacy PLCs, modern IoT sensors, and historical service records into a single predictive model. By tracking equipment age, operating environments, and maintenance intervals across the entire installed base, it identifies which specific machines are entering high-failure zones—enabling inventory repositioning before demand spikes materialize. This prevents both the emergency freight costs of reactive shipping and the capital waste of holding excessive safety stock for low-risk cohorts.
The model segments installed base by age cohorts and usage intensity rather than relying on aggregate sales history. By tracking run hours, maintenance intervals, and failure patterns for specific equipment vintages, it predicts when individual machines or cohorts will enter high-failure zones. This approach accounts for the reality that a 1995 turbine and a 2018 turbine have different risk profiles despite being the same product family.
Most industrial OEMs see measurable impact within 90-120 days. Early gains come from reducing emergency shipments on high-velocity SKUs where stockouts trigger overnight freight. Longer-term benefits emerge as inventory turns improve and dead stock is systematically eliminated. The compound effect of fewer expedited orders, lower carrying costs, and improved fill rates typically delivers 3-5x ROI within the first year.
The platform connects via standard APIs to SAP, Oracle, and other enterprise systems to pull current inventory positions, purchase orders, and sales history. It augments—rather than replaces—existing MRP logic by providing demand forecasts at a more granular level than traditional planning tools. Planners receive recommended stock targets by SKU and location, which they can approve and push back to the ERP for execution.
Yes. The platform maintains a knowledge graph of parts compatibility based on engineering specifications, historical substitutions, and technical documentation. When a primary SKU is out of stock, it suggests functionally equivalent alternatives with confidence scores. This reduces the need for expensive custom fabrication or extended customer wait times when legacy parts are obsolete.
At minimum, the system needs installed base records, parts transaction history, and basic equipment age data. Enhanced accuracy comes from integrating operational data like run hours, maintenance schedules, and failure event logs. Telemetry from SCADA or IoT sensors provides the highest-fidelity signal, but even without real-time data, the model can leverage historical patterns and equipment cohort analysis to outperform manual forecasting methods.

SPM systems optimize supply response but miss demand signals outside their inputs. An AI operating layer makes the full picture visible and actionable.

Advanced techniques for accurate parts forecasting.

AI-driven spare parts optimization for field service.
See how Bruviti's predictive inventory platform reduces carrying costs while improving fill rates for industrial equipment OEMs.
Schedule Demo