Cutting Service Parts Forecast Errors by 50%: What the Data Shows
Enterprise service parts deployments have cut forecast error from 17-18% to under 3%, reduced stockouts by 40%+, and recovered 15-20% in inventory carrying costs. These are documented results in organizations forecasting replacement parts for installed equipment, not theoretical projections from consumer goods or manufacturing supply chains.
The "AI reduces forecasting errors by 50%" claim, cited by McKinsey and reinforced in DP World's 2025 supply chain playbook, is real. But the conditions that make it real in a service supply chain are specific: you're forecasting intermittent demand (70-90% of the catalog), across multi-echelon distribution networks, where a stockout means a field technician leaves without fixing the equipment. That's a fundamentally different problem from production planning or retail replenishment.
Here is what the data shows about when the 50% benchmark applies, why service forecasting is structurally different, and how much service parts organizations can realistically expect from AI-driven forecast improvement.
Where the 50% Claim Comes From
The statistic originates from research covering broad supply chain operations, primarily manufacturing and retail distribution. McKinsey's analysis found that AI-enabled supply chain management can reduce forecasting errors by 20-50%, with the high end achieved by organizations that combine machine learning with expanded data integration. DP World's 2025 playbook confirmed similar ranges across their logistics network.
These are credible findings, but they describe a different forecasting problem. Manufacturing supply chains forecast production inputs against known demand schedules. Retail supply chains forecast consumer purchasing against seasonal patterns and promotional calendars. Both operate with relatively consistent demand signals and established historical patterns.
Service supply chains forecast replacement demand for parts that support installed equipment across the full post-warranty lifecycle: customer support, field service dispatch, help desk triage, warranty claims, and preventive maintenance programs. The demand pattern is fundamentally different. A part might move three units in six months, then spike to forty in a single week when a batch quality issue surfaces. Traditional statistical methods, including Croston's method and bootstrapping, were designed for consumer goods cadence, not this kind of intermittent, event-driven demand.
So the question isn't whether AI can reduce forecasting errors by 50% somewhere. It's whether that result translates to the specific conditions of service parts forecasting.
Why Service Supply Chain Forecasting Is Different
Four characteristics make service parts forecasting structurally harder than production or retail forecasting.
Intermittent demand dominates the catalog. Industry data consistently shows that 70-90% of a service parts catalog consists of intermittent demand items, SKUs with zero movement for months followed by unpredictable spikes. Traditional forecasting models need pattern repetition to generate predictions. When a part moves twice in a year, there is no repeating pattern for the model to learn from. A 2024 study in the International Journal of Forecasting examined whether human planners can compensate for this data scarcity. The finding: manual overrides improve accuracy only half the time, and upward adjustments make the forecast worse more often than they help.
The consequences of error are operational, not financial alone. In a manufacturing supply chain, a forecast miss means carrying cost or a delayed order. In a service supply chain, a forecast miss means a field technician arrives at a customer site without the right part. Aberdeen Group data quantifies the damage: parts unavailability is behind 51% of failed first visits. Every failed fix generates roughly 1.6 follow-up dispatches, each costing $200-300 in technician time, vehicle, and scheduling overhead. For a service organization running thousands of dispatches per month, forecast error directly drives service cost, customer satisfaction, and SLA compliance.
Multi-echelon distribution adds complexity. Service parts don't flow from a single warehouse to a customer. They move through a multi-echelon network: central distribution, regional depots, forward stocking locations, and van stock on technician vehicles. Each echelon needs its own demand forecast and inventory position. An accurate central forecast is insufficient if the wrong parts are staged at the wrong regional location. The industry average fill rate sits at 85-92%, with best-in-class organizations achieving 95-98%+. The gap between these levels represents millions in service penalties and customer churn.
The demand signal is fragmented across systems. The intelligence that predicts service parts demand sits in systems the planning engine typically cannot access: quality management systems tracking defect trends, CRM platforms recording customer complaints and forward bookings, field service management tools capturing technician observations, IoT platforms detecting equipment degradation, and warranty systems processing claims data. Each of these systems contains signals that precede parts demand by days or weeks. But when the planning system only sees historical shipment data and a quarterly install base file, it is forecasting with a fraction of the available intelligence.
What 50% Error Reduction Looks Like in Practice
Enterprise deployments focused on service parts have achieved results that match or exceed the 50% benchmark, but through a specific mechanism: expanding the demand signal rather than building a better statistical model.
The clearest documented example: a semiconductor equipment manufacturer reduced 4-week forecast error from 17-18% to under 3% on $50M+ quarterly parts spend, generating $2M+ in annual savings. The improvement came not from changing the forecasting algorithm, but from connecting quality system data, install base lifecycle signals, and field service intelligence into the demand forecast.
Across service parts deployments, the pattern holds:
| Metric | Before (Traditional) | After (AI Signal Expansion) |
|---|---|---|
| Forecast accuracy (A-class SKUs) | 50-70% accuracy (industry norm) | ≤8% MAPE |
| Forecast accuracy (B/C-class SKUs) | 40-60% accuracy | ≤12% MAPE |
| Stockout rate | Industry average | 40%+ reduction |
| Inventory carrying cost | Baseline | 15-20% reduction |
| First-time fix rate | 75-80% | 88% |
| Planning cycle time | Baseline | 80% faster |
The first-time fix rate improvement deserves specific attention. Moving from 75-80% to 88% FTFR doesn't just reduce truck rolls. In one deployment, that improvement eliminated approximately 30,000 unnecessary dispatches, each representing a technician, a vehicle, scheduling overhead, and a customer waiting for resolution. At $200-300 per dispatch, the financial impact of better parts availability compounds rapidly.
The Conditions That Make It Work
Not every service parts organization will see 50% error reduction. The magnitude of improvement depends on three factors.
How much demand signal is currently invisible. Organizations where the planning system operates on historical shipments and a quarterly install base update have the largest gap between available intelligence and utilized intelligence. Connecting quality data, field service records, warranty claims, and IoT telemetry into the demand signal closes that gap. The wider the gap, the bigger the improvement. Organizations that have already integrated some of these sources will see more modest gains (15-25% error reduction) because the marginal signal is smaller.
How much of the catalog is intermittent. The AI advantage is greatest for B/C-class intermittent demand items, which typically represent 70-90% of the catalog but receive the least planning attention. Traditional methods achieve ≤12% MAPE on these items only when augmented with class-level learning, where the AI uses behavior patterns from functionally similar parts across equipment families to compensate for sparse individual history. A part with three data points in a year can borrow signal from dozens of ontologically related SKUs. For high-volume A-class parts with established seasonal patterns, both traditional and AI methods already achieve ≤8% MAPE, so the improvement differential is smaller.
Whether the organization can act on better forecasts. Forecast accuracy improvement only translates to operational results when the planning and execution systems can respond. An organization with rigid min/max policies, quarterly review cycles, and manual replenishment triggers will capture less value than one with dynamic optimization. In deployments where operational responsiveness matched forecast improvement, planning cycle times dropped by 80% and planner override rates fell significantly, freeing capacity for strategic work like vendor negotiations, lifecycle planning, and network optimization.
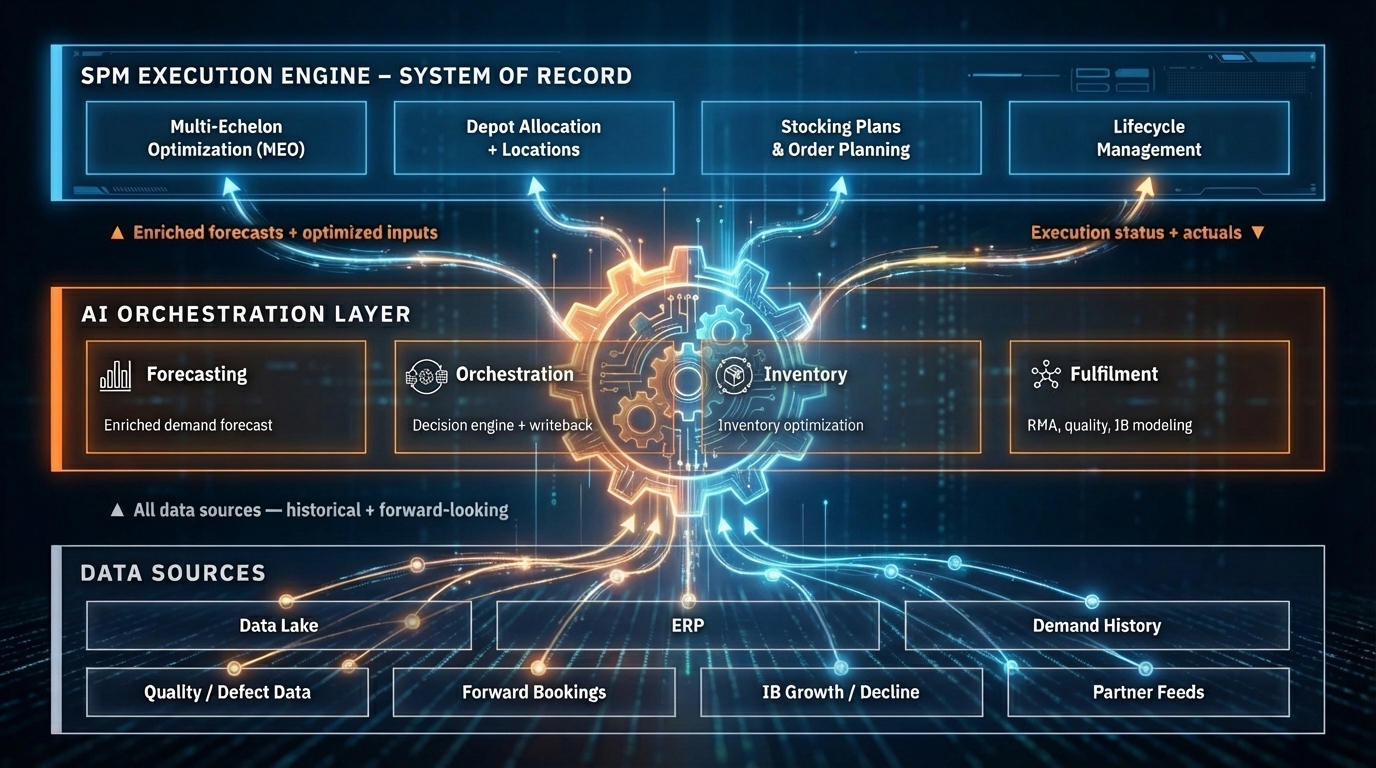
For the technical architecture behind signal expansion, how an AI operating layer connects to the existing SPM system without replacing it is covered in detail in our companion article.
What Happens When Forecast Errors Stay Above 40%
The cost of not improving forecast accuracy is not static. It compounds across the service supply chain through five interconnected channels.
Expedited shipping absorbs margin. APQC data draws a sharp line between organizations that anticipate demand and those that react to it: top performers allocate 3% of logistics spend to expedited shipping, while bottom performers burn through 10% or more. At $2B in revenue, closing that gap recovers roughly $3.4M annually, money that currently subsidizes poor forecast accuracy.
Excess inventory accumulates. When planners don't trust the forecast, they compensate with safety stock buffers. Excess and obsolete stock, typically 15-20% of total inventory value in service organizations, is the physical residue of low forecast confidence. Planners set high safety stock buffers because they don't trust the numbers. When accuracy improves, those buffers shrink naturally. SPM vendors consistently document 20-35% inventory value reductions after forecast upgrades, driven by right-sized buffers rather than indiscriminate cuts.
First visits fail. The 51% parts-unavailability failure rate documented by Aberdeen Group means that for every 100 service calls dispatched with poor demand planning, roughly 50 will require a return visit. At 1.6 additional dispatches per failure and $200-300 per truck roll, a 1,000-dispatch-per-month operation bleeds $160,000-240,000 monthly in avoidable revisits. That cost scales linearly with dispatch volume.
Planners spend time compensating, not optimizing. When forecast accuracy is low, planners spend their time on manual overrides, exception processing, and firefighting stockouts. This is skilled labor doing reactive work. In enterprise deployments where AI-driven signal expansion has improved the base forecast, planner override rates drop, and capacity shifts to strategic work: vendor negotiations, lifecycle planning, network optimization, and new product introduction forecasting.
Service contracts become unprofitable. Outcome-based service contracts, increasingly common in equipment-intensive industries, tie revenue to uptime guarantees and SLA compliance. When parts availability is uncertain, the risk pricing on these contracts must account for potential failures. Organizations with higher forecast accuracy can price contracts more aggressively because their cost-to-serve is more predictable. The difference between 85% and 95% fill rate, a 10-point gap driven primarily by forecast quality, can shift a service contract from margin-negative to profitable.
How Service Organizations Get Started
The path from current-state forecasting to measurable error reduction centers on three decisions, not a multi-year transformation roadmap.
Decision 1: Identify the highest-value signal gap. Most service parts organizations already know where their blind spots are. If quality events routinely trigger demand spikes that the planning system misses, quality data is the first integration target. If install base changes drive 30-40% of demand variation but the base file updates quarterly, real-time lifecycle data is the priority. The goal is to close the single largest gap first and measure the accuracy impact within 3-4 weeks.
Decision 2: Define success by operational outcomes, not model metrics. MAPE improvement matters, but the business case lives in three downstream numbers: fill rate by echelon (target: 95%+ vs. the 85-92% industry average), first-time fix rate (target: 85%+ vs. the 75% industry average), and inventory carrying cost reduction (target: 15-20% within 90 days). Tracking all three from day one connects the forecast improvement to results the executive team cares about.
Decision 3: Preserve the existing SPM investment. The AI layer improves what the planning system sees, not how it calculates. The SPM system, its optimization logic, its planning workflows, its user interfaces, all remain in place. This matters for organizations that have spent years configuring their planning environment. Enterprise deployments consistently show that signal expansion, connecting 4-6 additional data sources into the demand forecast, delivers 80% of the accuracy improvement without touching the forecasting model itself.
The Bottom Line
The 50% forecast error reduction claim is real, but it is not universal. It applies most strongly to service supply chain organizations where the demand signal feeding the planning system is significantly narrower than the intelligence available across the enterprise. For organizations still forecasting service parts from historical shipments and a quarterly install base file, the gap is large and the improvement potential matches the research benchmarks.
For the architectural detail on how an AI operating layer expands the demand signal without replacing the SPM, see Cut Service Parts Forecast Errors by 50%: What Changes With an AI Layer. For the structural limitations in modern SPM systems that create the forecast accuracy ceiling, see The Four Structural Gaps in Modern SPM Systems.
Bruviti builds AI operating layers for the service supply chain. If you're evaluating whether AI-driven forecast improvement applies to your parts operation, we'd welcome the conversation.