Hyperscale operators demand instant resolution. Manual log parsing and fragmented tools create bottlenecks your API stack can eliminate.
Automated remote support workflows integrate telemetry parsing, log analysis APIs, and guided troubleshooting SDKs to resolve data center equipment issues without manual escalation, reducing session duration and unnecessary field dispatches.
Support engineers spend hours parsing IPMI logs and BMC sensor data across thousands of nodes. Each remote session requires manual correlation of thermal, power, and memory telemetry before identifying root cause.
Remote access platforms, log aggregators, and knowledge bases operate in silos. Engineers toggle between five applications per session, losing context at each handoff and duplicating data entry.
Resolutions live in senior engineers' heads or scattered Confluence pages. When escalations occur, the receiving engineer restarts diagnosis from scratch because session context doesn't transfer.
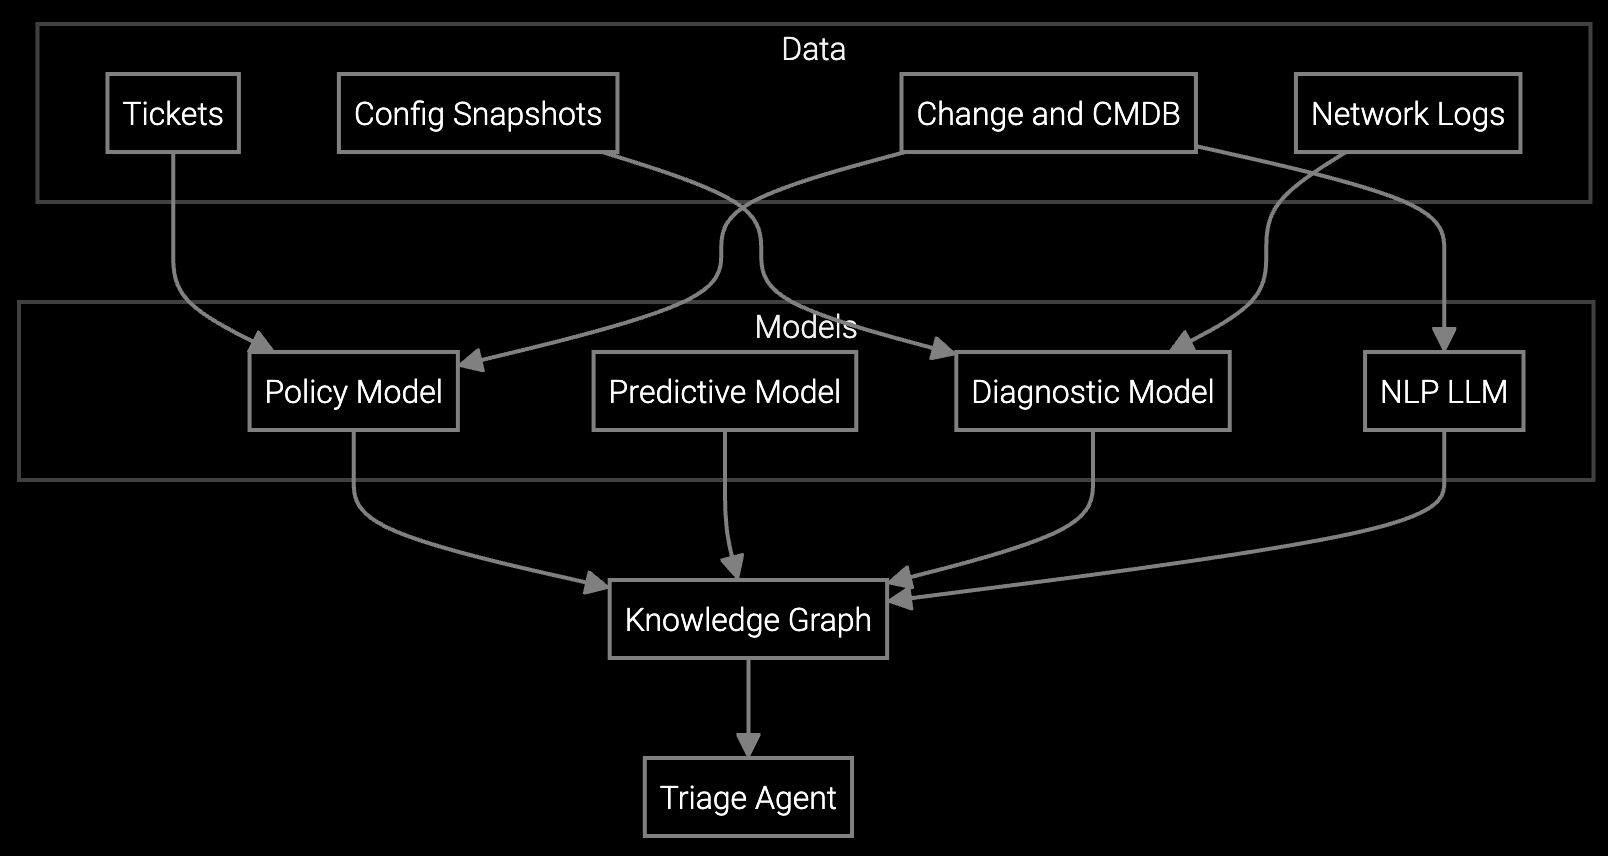
Event-driven architectures eliminate manual handoffs. BMC telemetry streams through REST APIs that parse thermal anomalies, power fluctuations, and memory errors in real time. Python SDKs expose pre-trained models for RAID failure prediction, firmware correlation, and hot spot detection—no ML expertise required.
Integration points connect your existing remote access stack without vendor lock-in. Webhook triggers auto-populate case notes, order replacement drives from inventory APIs, and escalate with full diagnostic context. TypeScript SDKs let you customize troubleshooting decision trees while the platform handles log ingestion, pattern matching, and knowledge retrieval. You own the workflow logic; the platform provides the intelligence layer.
Data center OEMs face unique telemetry scale—millions of IPMI events per hour, PUE thresholds under 1.4, and four-nines availability SLAs. Automated workflows must parse BMC sensor streams, correlate RAID controller logs with thermal data, and identify hot aisle failures before they cascade.
API endpoints ingest Redfish telemetry, legacy IPMI feeds, and proprietary management protocols simultaneously. Pre-trained models detect drive failure signatures, memory error patterns, and power supply degradation specific to server, storage, and cooling equipment. Webhook triggers auto-escalate thermal anomalies to HVAC teams while preserving full diagnostic context for the receiving engineer.
REST APIs handle telemetry ingestion, log parsing triggers, and resolution webhooks. Python and TypeScript SDKs expose pre-trained models for failure prediction, guided troubleshooting decision trees, and knowledge retrieval. GraphQL endpoints provide real-time session state and diagnostic context for escalation handoffs. All APIs support OAuth2 authentication and return JSON responses with standard error codes.
Webhook listeners ingest IPMI and Redfish streams in real time. Pattern matching algorithms correlate thermal sensor data, memory errors, and power fluctuations across node clusters. When thresholds breach, APIs auto-trigger diagnostic workflows—RAID analysis for storage faults, thermal mapping for cooling issues, firmware checks for BMC inconsistencies—without manual engineer intervention.
Yes. SDKs expose the decision tree framework as configurable JSON schemas. You define conditional branches, diagnostic tests, and resolution steps while the platform handles knowledge retrieval, log parsing, and context preservation. Changes deploy via API without retraining models. You maintain full control over workflow logic and can A/B test modifications across support teams.
You choose per data type. Sensitive BMC credentials and proprietary telemetry schemas can process on-premises using containerized inference engines. Anonymized log patterns sync to cloud models for training improvements. API configurations specify data residency per endpoint, and all processing locations are auditable through admin dashboards with SOC2 compliance logging.
Context-aware handoff webhooks package full session history—telemetry snapshots, attempted resolutions, and decision tree paths—into structured JSON payloads. When escalating, APIs auto-populate receiving engineer dashboards with BMC state, log excerpts, and recommended next steps. No manual note transfer or context loss. The escalated engineer sees exactly what the prior engineer saw, plus AI-suggested solutions based on similar past escalations.
Software stocks lost nearly $1 trillion in value despite strong quarters. AI represents a paradigm shift, not an incremental software improvement.
Function-scoped AI improves local efficiency but workflow-native AI changes cost-to-serve. The P&L impact lives in the workflow itself.

Five key shifts from deploying nearly 100 enterprise AI workflow solutions and the GTM changes required to win in 2026.
Get API documentation and SDK examples for your data center equipment stack.
Talk to an Engineer